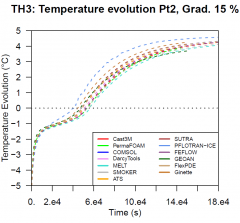
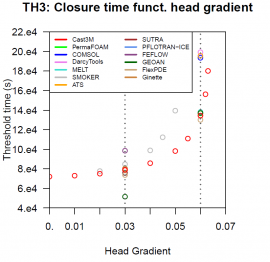
The results of the first phase of the intercomparison is completed and a paper presenting the test cases and results has been submitted to Advances in Water Resources, 27th July 2017.
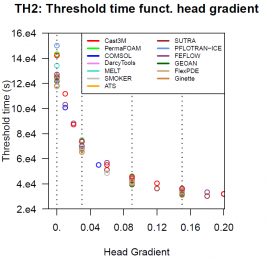
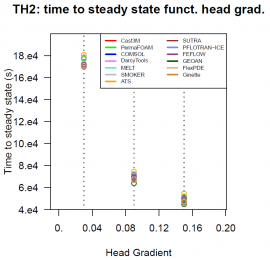
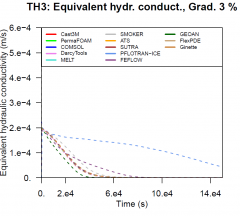
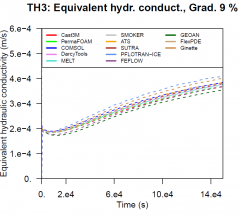
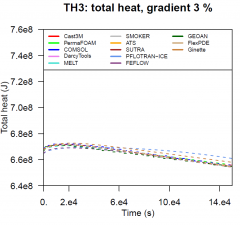
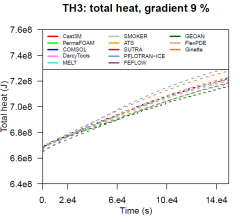
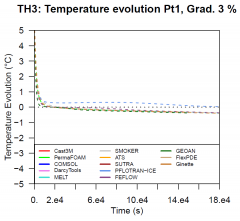
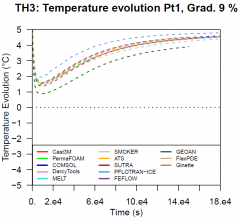
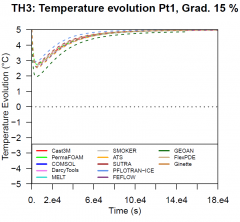
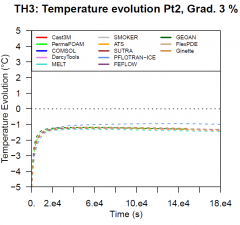
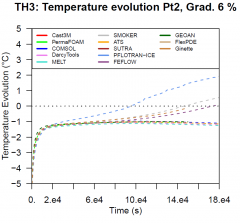
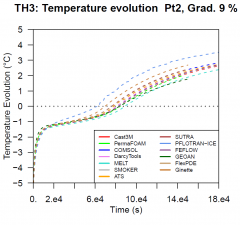
The approach consisted of intercomparison of simulation results based on a series of Performance Metrics (PMs) for the two test cases (TH2 and TH3). While the main results and general conclusions drawn are to be found in the paper, including a subset of PM figures, for code development purposes, access to the full set of PM can be usefull. It is included below.
Case TH2
4 head gradients are considered: 0, 3, 9, 15 %.
| PM | 0% | 3% | 9% | 15% |
| TH2_PM1 (temperature minimum) |  |  |  | 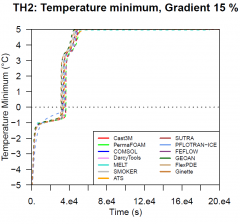 |
| TH2_PM2 (net total heat flux) |  |  | 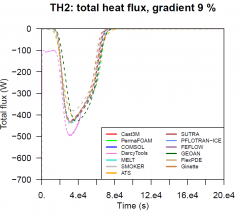 |  |
| TH2_PM3 (total liquid water volume) |  | 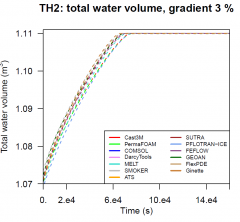 | 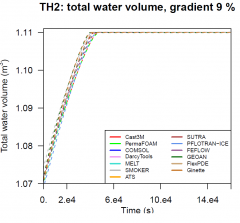 | 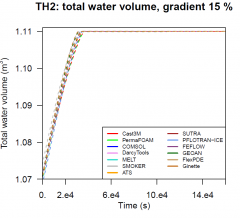 |
Case TH3
4 head gradients are considered: 3, 6, 9, 15 %.
