other:python:maps_by_jyp
This is an old revision of the document!
JYP's map room
You will find below a gallery of maps made with cartopy.
This page is under construction and its content may change drastically. The source codes are on LSCE servers, that you can hopefully access (too bad otherwise…)
PFT map
- Summary: Plot two PFT maps on a page
- Authors: Camille Contoux & Jean-Yves Peterschmitt
- Date: September 2019
- Script:
~jypeter/CDAT/Progs/Devel/contoux/plot_PFT_plio_pi.py
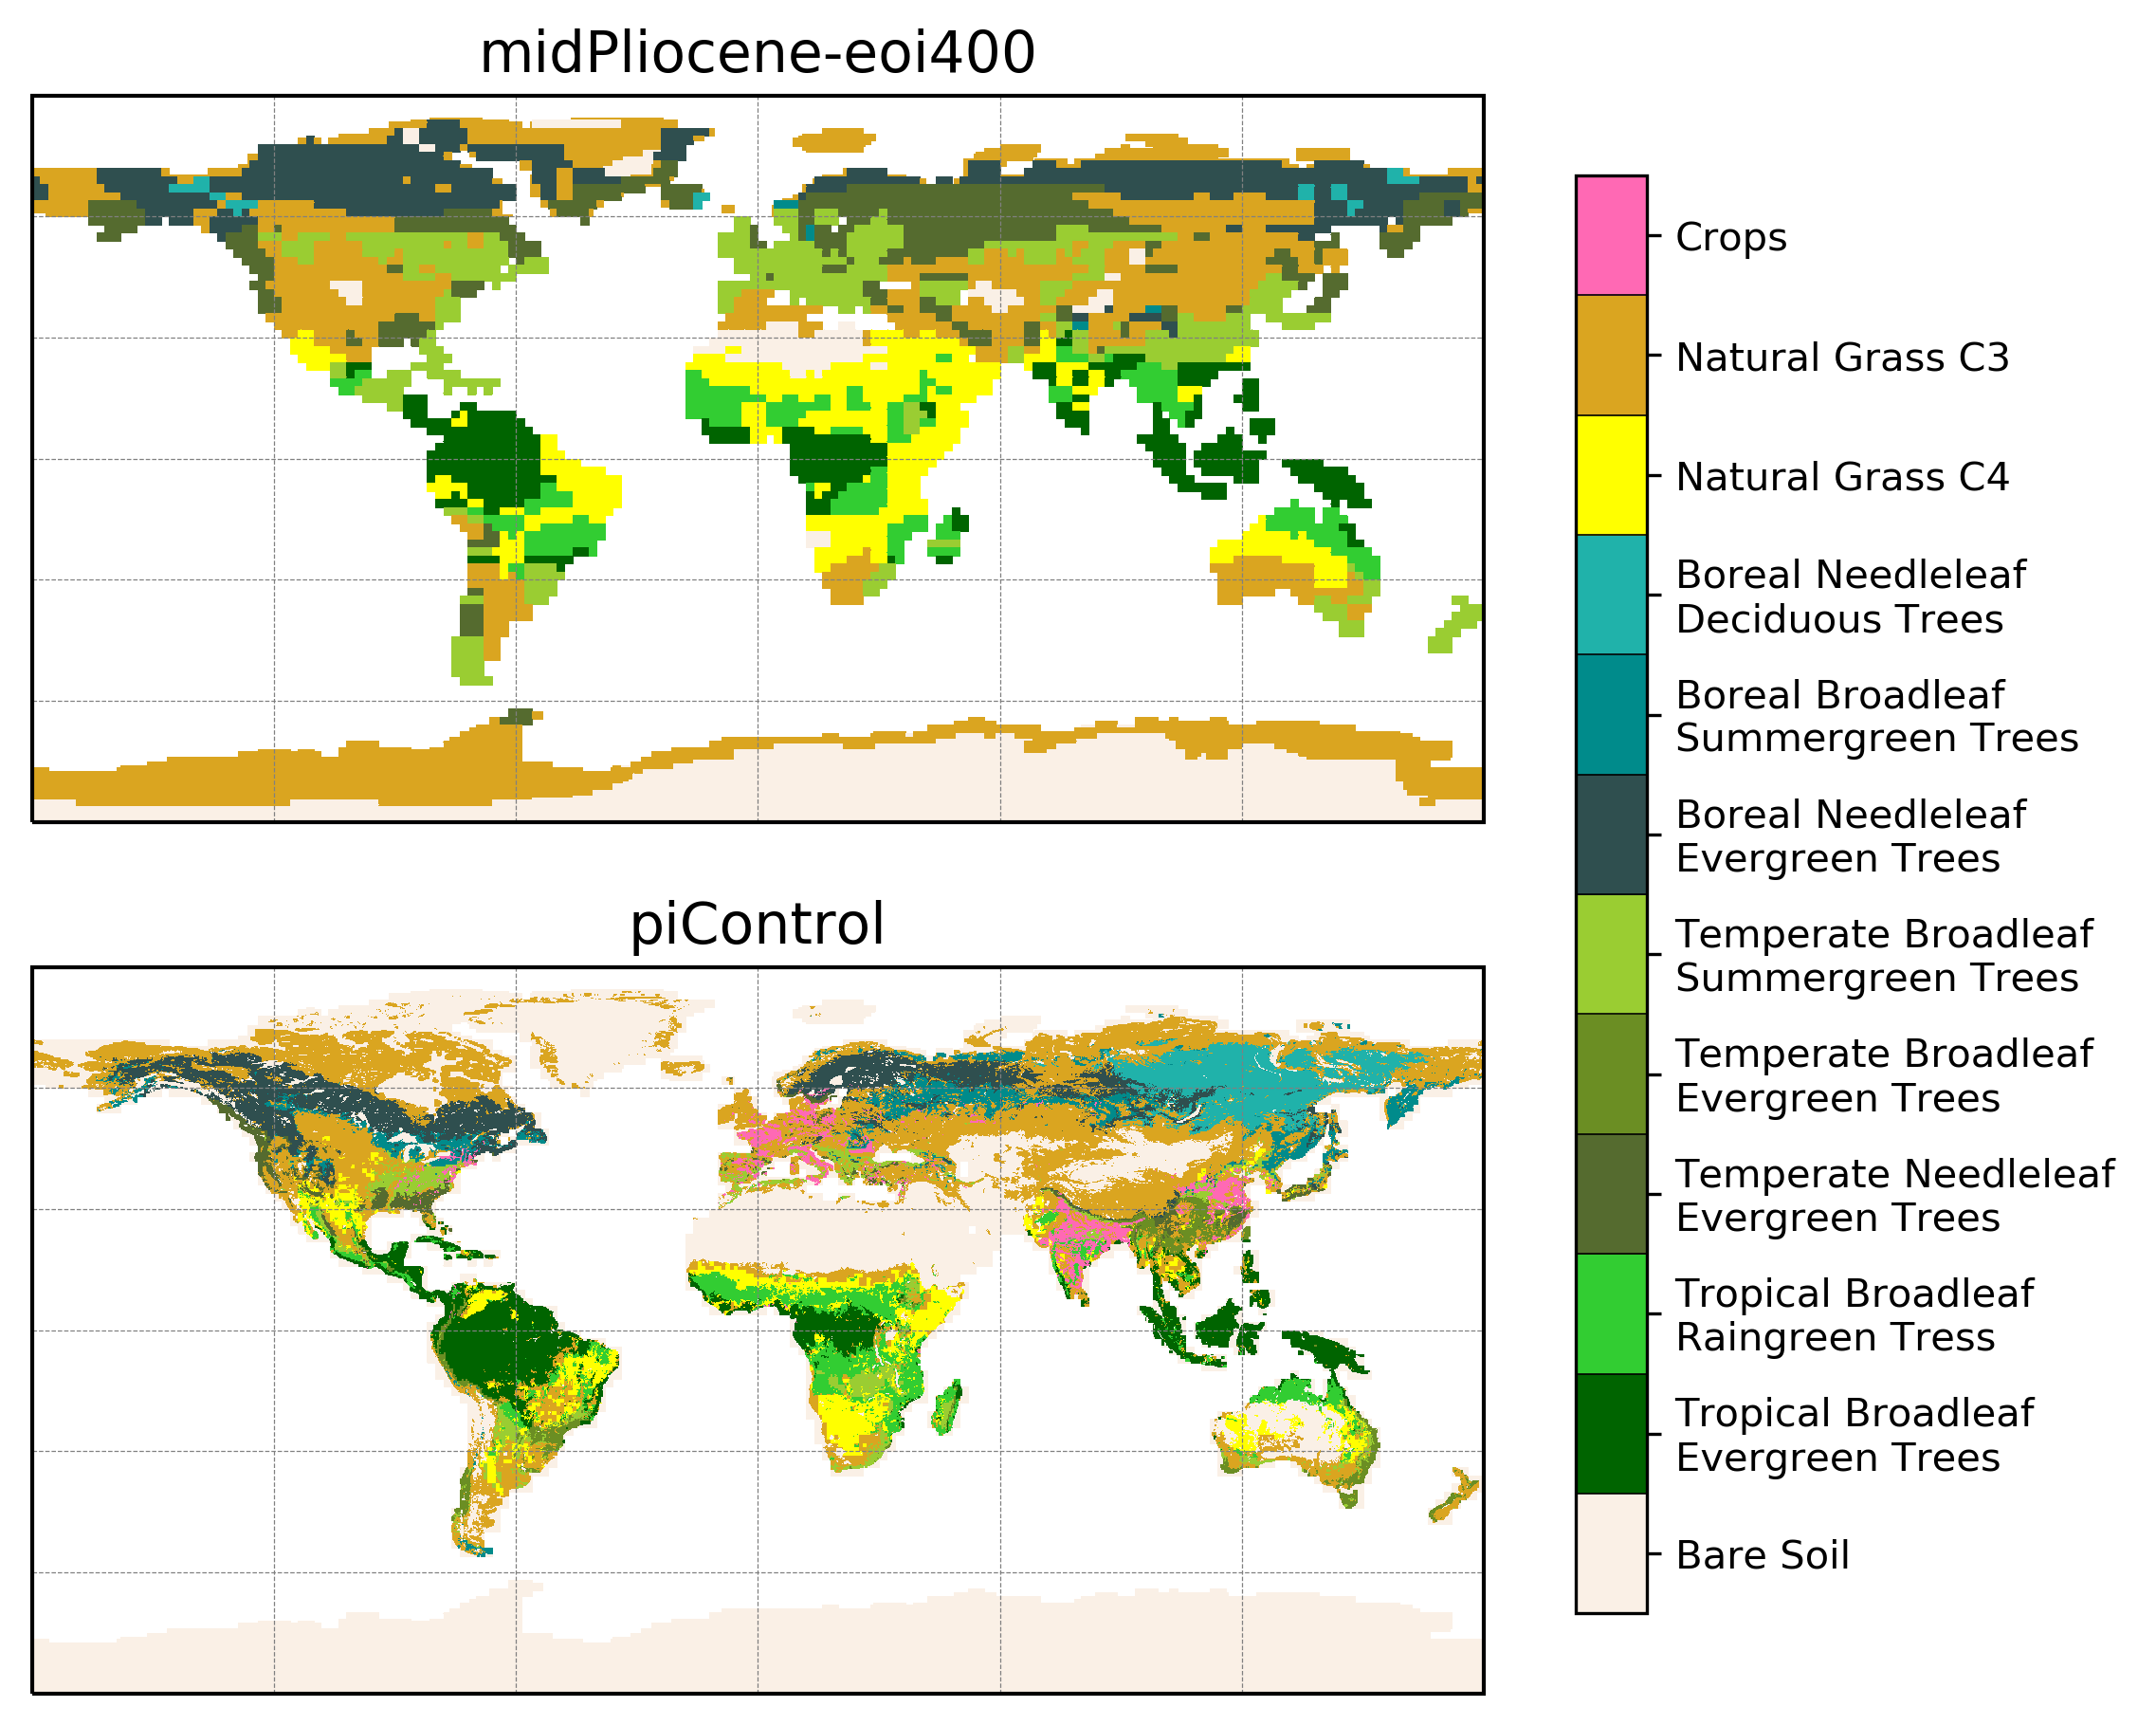
- Load the NetCDF data with
cdms2 - Optionally reduce the number of PFTs before plotting
- Use
matplotlib+cartopyto create the plot- Create two plots with a common colorbar
- Use a listed colormap (and the associated norm), and pcolormesh to plot the discrete PFT values
[ PMIP3 Wiki Home ] - [ Help! ] - [ Wiki syntax ]
other/python/maps_by_jyp.1568302749.txt.gz · Last modified: by jypeter