Table of Contents
Ice Sheet for PMIP3/CMIP5 simulations
Use the discussion panel at the end of the page for comments
Introduction
Several PMIP participants are in favour of using a new ice-sheet reconstruction that better matches the geomorphologic and glaciological constraints than ICE-5G used in PMIP2. We plan thus to have - a reference ice-sheet for the core simulations - alternatives for groups interested to run sensitivity experiment in order to discuss the sensitivity of the model results to the uncertainties in boundary conditions.
We are now considering the possibility to use a new ice-sheet reconstruction proposed by Lev Tarasov and/or Dick Peltier (see text below). The final decision on the ice-sheet will be taken in October. It will depend on what is available at that time, quality checking and climate model constraints. We will involve several PMIP participants in the process, and you are all invited to comment on the proposition in the discussion panel (at the bottom of this page). It is still possible that we have to find an alternative and less rigorous option by the end of September, which is the deadline to finalize the boundary condition for CMIP5.
From what is ready today, you can find below
- a description of what is going on for the new reconstruction using both ICE-5G constraints and a glaciological model (the Lev-MOCA proposition discussed for PMIP3 deglaciation sub-project)
- a new reconstruction using a new version of Dick's model (ICE-6G)
Please have a look at these files and make all the comments that can help us to finalise the CMIP5 boundary conditions rapidly.
Details on the proposed LGM and deglacial ice-reconstructions
Comparing the different reconstructions
The following plots were generated using the latest versions of the reconstructions available (inserted by Fuyuki Nov 13 2009).
- Combined Surface Altitude and Fraction of Grid Cell Covered with Glacier
- for ANU ice model (2009) incl. British area.
- for ICE-6G v1.02
- for GLAC-1 nn454 model for North America, and ne8234 for Eurasia
- for GLAC-1 nn9014 model for North America, and ne8234 for Eurasia
The following plots have been prepared by Ayako Abe-Ouchi and Saito Fuyuki (put online, 11/13/09 @ 13h03)):
- Antarctica plots
- Northern Hemisphere plots
The following plots were generated using the latest versions of the reconstructions available to the persons who made the plots and may be more up-to-date than the plots available in the sections below. Please try to use the most recent plots when commenting the reconstructions!
PMIP3_ice-sheet_comparison_NH.pdf
PMIP3_ice-sheet_comparison_SH.pdf
GLAC-1
- Surface Altitude, using nn454 model ensemble for North America, GrbB model for Greenland, and ne8234 for Eurasia
GLAC1_nn454_ne8234.pdf (generated by Jean-Yves Peterschmitt, put online, 10/29/09 @ 15h30)
ICE-6G v1.02
- Surface Altitude and Fraction of Grid Cell Covered with Glacier
- for ICE-6G v1.02
- and for GLAC-1 nn442 model for North America, GLAC-1 nn8191 for Eurasia, and ICE-6G v1.02 for Antarctica
ICE-6G_compare_v1.02_GLAC-1.pdf (generated by Jean-Yves Peterschmitt, put online, 10/29/09 @ 16h40)
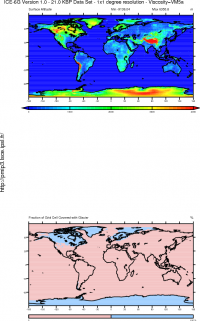
Figure 01 ⇒ [Var = orog] ice6g_v1.02 @ 21.0k
Figure 02 (polar) ⇒ [Var = orog] ice6g_v1.02 @ 21.0k
Figure 03 ⇒ [Var = orog] ice6g_v1.02 @ 21.0k - ice6g_v1.02 @ 00.0k
Figure 04 (polar) ⇒ [Var = orog] ice6g_v1.02 @ 21.0k - ice6g_v1.02 @ 00.0k
Figure 05 ⇒ [Var = orog] ice6g_v1.02 @ 21.0k - ice6g_v1.0 @ 21.0k
Figure 06 (polar) ⇒ [Var = orog] ice6g_v1.02 @ 21.0k - ice6g_v1.0 @ 21.0k
Figure 07 ⇒ [Var = sftgif] ice6g_v1.02 @ 21.0k
Figure 08 (polar) ⇒ [Var = sftgif] ice6g_v1.02 @ 21.0k
Figure 09 ⇒ [Var = sftgif] ice6g_v1.02 @ 21.0k - ice6g_v1.02 @ 00.0k
Figure 10 (polar) ⇒ [Var = sftgif] ice6g_v1.02 @ 21.0k - ice6g_v1.02 @ 00.0k
Figure 11 ⇒ [Var = sftgif] ice6g_v1.02 @ 21.0k - ice6g_v1.0 @ 21.0k
Figure 12 (polar) ⇒ [Var = sftgif] ice6g_v1.02 @ 21.0k - ice6g_v1.0 @ 21.0k
Figure 13 ⇒ [Var = orog] ice6g_v1.02_nn442_8191b @ 21.0k
Figure 14 (polar) ⇒ [Var = orog] ice6g_v1.02_nn442_8191b @ 21.0k
Figure 15 ⇒ [Var = orog] ice6g_v1.02_nn442_8191b @ 21.0k - ice6g_v1.02_nn442_8191b @ 00.0k
Figure 16 (polar) ⇒ [Var = orog] ice6g_v1.02_nn442_8191b @ 21.0k - ice6g_v1.02_nn442_8191b @ 00.0k
Figure 17 ⇒ [Var = orog] ice6g_v1.02_nn442_8191b @ 21.0k - ice6g_v1.0 @ 21.0k
Figure 18 (polar) ⇒ [Var = orog] ice6g_v1.02_nn442_8191b @ 21.0k - ice6g_v1.0 @ 21.0k
Figure 19 ⇒ [Var = sftgif] ice6g_v1.02_nn442_8191b @ 21.0k
Figure 20 (polar) ⇒ [Var = sftgif] ice6g_v1.02_nn442_8191b @ 21.0k
Figure 21 ⇒ [Var = sftgif] ice6g_v1.02_nn442_8191b @ 21.0k - ice6g_v1.02_nn442_8191b @ 00.0k
Figure 22 (polar) ⇒ [Var = sftgif] ice6g_v1.02_nn442_8191b @ 21.0k - ice6g_v1.02_nn442_8191b @ 00.0k
Figure 23 ⇒ [Var = sftgif] ice6g_v1.02_nn442_8191b @ 21.0k - ice6g_v1.0 @ 21.0k
Figure 24 (polar) ⇒ [Var = sftgif] ice6g_v1.02_nn442_8191b @ 21.0k - ice6g_v1.0 @ 21.0k
ANU ice model
Plots are modified. Please download again (fuyuki, Nov 13 2009)
- Combined Surface Altitude and Fraction of Grid Cell Covered with Glacier
- for ANU ice model (2009)
- for ICE-6G v1.02
- for GLAC-1 nn454 model for North America, and ne8234 for Eurasia
- for GLAC-1 nn9014 model for North America, and ne8234 for Eurasia
The following plots have been prepared by Ayako Abe-Ouchi and Saito Fuyuki (put online, 11/13/09 @ 13h03)):
- Antarctica plots
- Northern Hemisphere plots
Lev-MOCA
Northern Hemisphere (GLAC-1)
The Greenland model is from Tarasov and Peltier (2002 and 2003), a glaciological model with hand-tuned climate adjustments to enforce fit to Relative Sea-Level (RSL) records and the GRIP borehole temperature record. It was also validated against observed rated of present day uplift for 3 sites and against GPS measurements for horizontal ice surface velocity. A variant of it is the Greenland component of ICE-5G and ICE-6G.
The North American and Eurasian reconstructions are objective Bayesian calibrations of the MUN/UofT glacial systems model. The latter incorporates a 3D thermo-mechanically coupled (shallow) ice-sheet model, with permafrost resolving bed-thermal model, asynchronously coupled down-slope surface drainage/lake depth solver, and various other components such as a thermodynamic lake ice, sub-glacial till-deformation, bouyancy and temperature dependant calving law, ice-shelf represention, …, some of which are described in Tarasov and Peltier, QSR 2004, and Nature 2005, and a more complete description is currently being written up). The visco-elastic bedrock response uses either the VM2 (as used in ICE-5G) or VM5a (used in ICE-6G) earth rheologies. Relative Sea Level is computed using a gravitationally self-consistent formalism similar to that of Peltier, except for an eustatic approximation for dealing with changing ocean masks and the lack of accounting for rotational effects (which are mostly significant for far-field RSL records, ie records that do not locally constrain ice load history).
Climate forcing involves an interpolation between present day observed climatologies and the set of highest resolution LGM fields from PMIP I and II data sets. The interpolation is weighted according to a glaciological inversion of the GRIP record for regional temperatures over the last glacial cycle.
The calibration involves approximately 30 (currently 36 for North Am, 29 for Eurasia) ensemble parameters to capture uncertainties in deglacial climate and ice dynamics. The majority of these parameters are used for the climate forcing, including weighting the inter-model (ie between PMIP models) EOFs for LGM monthly precip and temperature, regional desert elevation effects, and LGM atmospheric lapse rate. Other ensemble parameters adjust calving response, effective viscosity of subglacial till, strength of margin forcing, and flow parameters for ice-shelves. Model runs are forced to stay within uncertainties of the independently derived ice margin chronologies (Dyke, 2004 for North Am, Gyllencreutz et al, in preparation for Eurasia).
Model runs cover a full glacial cycle. North America and Eurasia are calibrated separately. Calibration targets include a large set of RSL observations, geologically-inferred deglacial ice-margin chronologies, and geodetic constraints. For the case of North America, the calibrated ensemble is further scored with respect to strand-lines (paleo lake level indicators) and Marine Limit (maximum level of marine inundation) observations. A key point is that model runs are penalized in proportion to the amount of margin forcing required. So the calibration is directed towards a climate forcing that is consistent with the margin chronology.
The model was calibrated using the ICE4G ice load reconstruction for Antarctica and the VM2 earth rheology because the ICE6G Antarctic chronology and VM5a earth model along with a much expanded geodetic dataset were provided by Dick Peltier only in early September, which left too little time to recalibrate the models. There is the added issue that the ICE6G Antarctic chronology lacks error bars. The expanded geodetic data-set for North America included significant revisions to the previous geodetic constraints. This along with the significant reduction in LGM ice volume in ICE6G Antarctic as compared to ICE4 and 5G rendered a significant misfit with the far-field Barbados RSL record. With the limited time, a somewhat blind and largely random 2000 member ensemble was generated along with a rerun of the best 300 previously calibrated parameter sets and some 200 attempts at hand-tuning. nn450 is the weighted distribution of 7 model runs that passed certain hard threshold constraints. nn9021 is the best (though “best” depends to a certain extent on the weighting between various constraints) single run from the previous calibration and nn445 is the weighted ensemble mean for that previous calibration.
The Eurasian calibration did converge, and aside from issues with the Norwegian fjords (the latter are also a problem for ICE6G), the calibration was generally successful. nn8234 is one of the best runs with the largest 26ka RSL contribution to the Barbados record. A single run was chosen to ensure consistency between drainage fields and the surface topography. The mean distribution for the calibration can be made available upon request.
In summary, the GLAC-1 submission provides a set of glaciological models that are derived from a plausible climate forcing based on PMIP1 and PMIP2 results for LGM and that fit independently derived ice margin chronologies. This provides strong constraints throughout deglaciation. For Eurasia, the smaller set of constraints (among other more speculative reasons) resulted in a successful calibration that reasonably well covered the available constraint set. North America has a much larger and much more diverse set of constraints (and I suspect a much more complicated ice/climate interaction history), so the calibration has never been able to fully satisfy the whole set of constraints (strandlines are for instance a challenge to fit given their high sensitivity to drainage choke point elevations).
Unfortunately, these glaciological models in combination with the ICE-6G chronology for Antarctica (and Patagonia) and Dick Peltier's VM5a earth rheology have at best a weak fit to the the LGM segment of the Barbados record. There is a significant tradeoff between Barbados fit and fit to other constraints. What is unclear at this stage is the extent to which this is due to deficiencies in the glaciological models, to problems with the ICE-6G Antarctic ice chronology, or possibly with inferred uncertainties in the Barbados record and with the VM5a earth rheology.
One possibility for resolving Barbados, is to take the 1.5 sigma upper limit of the previously calibrated ensemble for North America which almost reaches the inferred Barbados record for 26 to 21 ka. Dick Peltier and Rosemarie Drummond will cross-check this dataset. The problem with using ensemble bounds is that this is no longer a glaciologically self-consistent model and RSL fits have also deteriorated.
References
Data
Also, please note, that none of the above have yet been published, so these files are provided for discussion and consideration. Any fields and data not selected as a PMIP boundary condition are not to be used for research without prior consent.
- Get in touch with Lev Tarasov or Jean-Yves Peterschmitt if you want to download the following NetCDF files:
- NetCDF of 21 to 10ka surface elevation, thickness, basal velocities for the nn9021 North Am model and nn8234 Eurasian model: NAnn9021.nc, EAnn8234.nc
- NetCDF of 21 to 10ka for nn445 ensemble means and 1.5 sigma range: NAnn445.nc
- Other data available upon request from Lev Tarasov
Plots
- RSL plots for North Am and Eurasia
- North Am: (with nn8234 Eurasia)
rslGLAC1RSLcompAc.pdf nn9021 (as calibrated, ICE4G Antarctica, VM2),nn9021 with ICE6G Antarctica/VM5a, nn7280, nn445
rslGLAC1RSLcompBc.pdf nn9021, nn445, nn445+1sigma, nn445-1sigma
- Barbados: GLAC1RSLcompBbarbc.pdf (note will slightly over predict barbados RSL drop around LGM due to lack of rotational effects on RSL calculation)
- Surface elevation and basal ice velocity area maps for 21 ka
Note: lakes and drainage results are not included in these plots
21kaHuvnn8234.pdf, 18kaHuvnn8234.pdf, 14kaHuvnn8234.pdf
21kaHuvNA.pdf, 18kaHuvNA.pdf, 14kaHuvNA.pdf
Ice volume
The following table has been supplied by Lev Tarasov. It compares the ice amounts in the various regions in terms of eustatic sea level impact inferred by assuming the ocean area to remain fixed to the modern area (ice amount relative to now in m of ocean assuming ocean area = 360768576 km2).
| GLAC-1 21ka |
|
|---|---|
| North America (nn454) | 76.6 |
| Eurasia (nn8234) | 14.0 |
Southern hemisphere
Glaciological constraints have shown that the ICE-5G reconstruction was too high in East Antarctica. Several tests are now made using a revised version of ICE-5G (VM2=ICE-6G) to correct this aspect while keeping the global on sea level and other geomorphological constraints. Dick Peltier’s group is working now on smoothing the refined model and taking the extension of the loading of the shelf out to a distance from the present coast consistent with a specific bathymetry contour. The final version should be ready by September.
ICE-6G
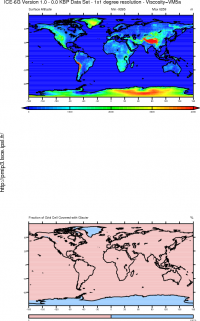
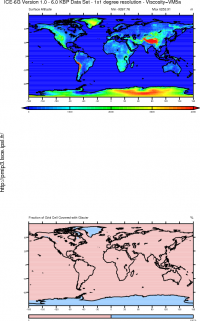
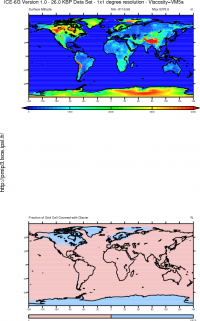
Using new calibrations and a revised version of his model, Dick Peltier proposes a revised version of the ice-sheet that should better match the different paleo data. The following figures are based on data supplied by Dick Peltier and Rosemarie Drummond (Sept 4th 2009 version). They are provided for evaluation and test, and do not correspond to the “official” boundary condition to be used for LGM simulations in CMIP5.
References
Note: get in touch with Jean-Yves Peterschmitt in you need a copy of the following papers.
- Peltier, W.R., 2009, Closure of the budget of global sea level rise over the GRACE Era: The importance and magnitudes of the required corrections for global glacial isostatic adjustment. Quat. Sci. Rev. 28, 1658-1674.
- Donald F. Argus and W. R. Peltier, 2009. Constraining models of postglacial rebound using space geodesy: A detailed assessment of model ICE-5G (VM2) and its relatives, Geophysical Journal International, submitted.
- W.R. Peltier and R. Drummond, 2008. Rheological stratification of the lithosphere: A direct inference basd upon the geodetically observed pattern of the glacial isostatic adjustment of the North American continent. geophys. res. Lett., vol. 35, L16314, doi:10.1029/2008GL034586.
- W. R Peltier, D. F. Argus, R. Drummond, R Gyllencreutz, J. Mangerud, J-I Swensen, and O. S. Lohne, Space Geodesy Constrains Ice-Age Terminal Deglaciation, Nature, submitted
Data
Notes:
- Get in touch with Jean-Yves Peterschmitt if you want to download the netcdf files used to generate the figures below
- Click on a figure to get the full size version
- You can compare the figures with the ICE-5G versions available on the PMIP2 web site
Ice volume
The following table has been supplied by Rosemarie Drummond. It compares the ice amounts in the various regions in terms of eustatic sea level impact inferred by assuming the ocean area to remain fixed to the modern area (ice amount relative to now in m of ocean assuming ocean area = 360768576 km2).
| ICE-4G final (1) | ICE-5G v1.2 (2) | ICE-6G v1.0 |
||||
|---|---|---|---|---|---|---|
| 21k | 26k | 21k | 26k | 21k | 26k | |
| North America (incl Innuit area) | 64.24 | 54.92 | 81.47 | 83.71 | 79.82 | 88.14 |
| Greenland & Iceland | 6.38 | 5.43 | 2.49 | 2.45 | 2.36 | 2.34 |
| Fennoscandia | 10.39 | 8.91 | 11.19 | 11.79 | 10.22 | 12.31 |
| Barents / Kara Seas | 14.05 | 12.26 | 8.43 | 9.29 | 7.26 | 9.10 |
| UK | 0.42 | 0.35 | 1.48 | 1.65 | 0.58 | 0.82 |
| Patagonia | 0.55 | 0.47 | 0.55 | 0.55 | 0.83 | 0.87 |
| West Antarctica | 9.74 | 8.33 | 9.68 | 9.68 | 11.79 | 11.79 |
| East Antarctica | 8.35 | 7.12 | 8.36 | 8.36 | 1.45 | 1.44 |
| Total | 114.12 | 97.79 | 123.63 | 127.48 | 114.31 | 126.81 |
| ice-shelves (3) | 2.80 | 3.00 | ||||
- (1) The version of the ICE-4G (VM2) model for which data are provided is not exactly the version that was employed in the original PMIP project but rather one from which a significant amount of Antarctic ice was simply eliminated (version employed for illustrative purposes in Peltier's paper for the Mt Hood volume of QSR).
- (2) The version of ICE-5G used for PMIP2/MOTIF was v1.1
- (3) The calculation only cares about grounded ice, so where it detects that the ice-model has ice that is below the predicted sea-level, it deems the ice to be melted and added to the ocean. The ice may be melted or be part of an ice-shelf eg the Ronne, Ross ice-shelves. This is a feature of the most recent version of the solver.
- The large change between ICE-4G (VM2) and ICE-5G (VM2) is due to the introduction of Art Dyke's margin chronology which had the ice being eliminated from North America earlier than in the original chronology obtained from John Andrews. This meant that more ice had to be removed in order to have the same impact on RSL during the ice-free Holocene interval.
- The large differences between ICE-5G (VM2) and ICE-6G (VM5a) are a combined result of the introduction of two further constraints:
- the analysis from Valerie Masson demonstrating that the elevation of East Antarctic ice was not significantly different than modern
- the results of the analyses based upon the application of the space geodetic constraints described in the Argus and Peltier paper.
ANU Ice Model
The ANU Ice Model description and data have been supplied by Kurt Lambeck
Model description
The ANU ice sheets are based on the inversion of geological sea level and shoreline data supplemented by observational evidence of ice margin locations and, in a few instances, by limiting ice thickness estimates. These models have evolved over a period of years in an iterative fashion.
Broadly, the first iterations are based on the analyses of far-field data where the sea-level signal is predominantly a measure of the changes in total ice volume (the ice-volume equivalent sea level or esl) with the principal isostatic component often being the water-load term and a function of the rate at which water is added into or removed from the oceans. Simple models are initially used for the ice sheets. The separation of mantle rheology from the esl function is achieved by using the spatial variability of the far-field sea-level signals (Nakada and Lambeck, 1990 #127 see http://rses.anu.edu.au/people/lambeck_k/index.php?p=pubs for references). The resulting ice function is then redistributed between the ice sheets by using simple scaling relations in the first place and the process is iterated to ensure some convergence (Lambeck, Yokoyama and Purcell, 2002 # 228).
In parallel inversions are attempted for the individual ice sheets using data from within and close to the ice margins. These observations are most sensitive to the ice models and mantle rheology. For the northern hemisphere these analyses are carried out separately for Scandinavia (Lambeck, Smither, and Johnston, 1998 #187, Lambeck et al., in press), Barents-Kara (Lambeck, 1995, 1996 #166, 170), Greenland (Fleming and Lambeck, 2004 #238), British Isles (Lambeck, 1993; 1995 #164, 156) and North America (as yet unpublished). In all cases new compilations of the field data have been made. These separate solutions allow for lateral variability in mantle viscosity. Some interactions between the ice sheets occur and the solutions are therefore iterated.
The Antarctic field data is insufficient for a similar analysis for the southern hemisphere and we use the difference between the global esl and the northern hemisphere esl to estimate the volume changes for Antarctica eslant (allowing for mountain deglaciation in both hemispheres, Lambeck and Purcell, 2005 #247). The ice in Antarctica is then distributed according to the LGM ice margins proposed by Anderson et al. (2002) and on the assumption that the ice profiles followed the quasi-parabolic function proposed by Paterson. The retreat history is determined by the eslant function. These models are not meant to be accurate reflections of the Antarctic ice history but as a convenient way of disposing of the ice volume that cannot be attributed to the northern hemisphere, in a way that will not impact in a major way on the far-field and northern hemisphere analyses.
With the new ice models the far-field analysis is repeated and the individual ice sheet analyses are also repeated. Several such iterations have now been carried out but the successive results have not yet been published. The LGM results provided here represent the most recent (2009) solution. The full solutions for some of the ice sheets extend back to MIS-6 (Lambeck et al., 2006 # 252).
The rebound inversions result in the changes in ice thickness compared to the present day ice volumes. Thus the LGM ice thickness is obtained by adding the present-day ice thickness. The LGM ice elevation, with respect to sea level at the LGM is obtained by subtracting the sea-level change (geoid change beneath the ice sheet) from the palaeo ice thickness.
The esl function as used in the ANU solutions is defined as all land ice and grounded ice on the shelves and the ocean margin at the LGM is defined by the ice grounding line (Lambeck et al., 2003 #233).
References
- Lambeck & Johnston, 1998: The viscosity of the mantle: evidence from analyses of glacial rebound phenomena. “The Earth's Mantle” (ed. I. Jackson). Cambridge University Press, Cambridge. pp 461-502
- Lambeck, Purcell, Johnston, Nakada & Yokoyama, 2003: Water-load definition in the glacio-hydro-isostatic sea-level equation. Quaternary Science Reviews, vol. 22, pp 309-318
- Lambeck, & Chappell, 2001: Sea level change through the last glacial cycle. Science, 292, 679-686.
- Lambeck, Yokoyama & Purcell, 2002: Into and out of the Last Glacial Maximum: sea-level change during Oxygen Isotope Stages 3 & 2. Quaternary Science Reviews, vol. 21, pp 343-360
Ice volume
The following table has been supplied by Ayako Abe-Ouchi. It compares the ice amounts in the various regions in terms of eustatic sea level impact inferred by assuming the ocean area to remain fixed to the modern area (ice amount relative to now in m of ocean assuming ocean area = 360768576 km2).
| ANU | ICE-6G v1.0 |
|
|---|---|---|
| 21k | 21k | |
| ANT (1) | 29.0 | 13.2 |
| NA (2) | 82.5 | 79.8 |
| EUR (3) | 18.2 | 18.1 |
| Tot (4) | 129.7 | 111.1 |
- (1) ANT = East plus West Antarctica
- (2) NA = Laurentide ice sheet
- (3) EUR = rest of the ice sheets except for Greenland and Patagonia
- (4) Total is excluding Greenland and Patagonia change
Plots
Plots are modified. Please download again (fuyuki, Nov 13 2009)
The following plots have been prepared by Ayako Abe-Ouchi and Saito Fuyuki:
- Antarctica plots
- Northern Hemisphere plots
The plots show the combined Surface Altitude and Fraction of Grid Cell Covered with Glacier, and use data from:
- for ANU ice model (2009)
- for ICE-6G v1.02
- for GLAC-1 nn454 model for North America, and ne8234 for Eurasia
- for GLAC-1 nn9014 model for North America, and ne8234 for Eurasia
Conclusion
In September we should be able to compare the results of the revised version of ICE-6G with those of the Lev-Dick collaboration and take a decision based on comparisons with data and on the advice of the community
[ PMIP3 Wiki Home ] - [ Help! ] - [ Wiki syntax ] - [ Top ]


