Table of Contents
Pollen-based continental climate reconstructions for the mid-Holocene and the Last Glacial Maximum
Reference
Pollen-based continental climate reconstructions at 6 and 21 ka: a global synthesis
Bartlein, P. J., S. P. Harrison, S. Brewer, S. Connor, B. A. S. Davis, K. Gajewski, J. Guiot, T. I. Harrison-Prentice, A. Henderson, O. Peyron, I. C. Prentice, M. Scholze, H. Seppä, B. Shuman, S. Sugita, R. S. Thompson, A. E. Viau, J. Williams, H. Wu, 2011. , Climate Dynamics, 37, 775-802.
DOI 10.1007/s00382-010-0904-1
Description
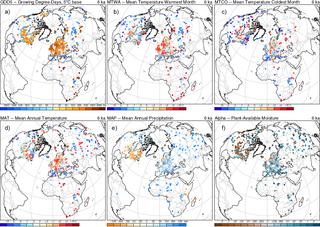
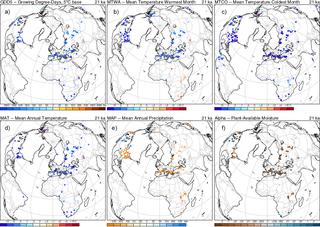
These data are a synthesis of existing and available quantitative reconstructions of six bioclimatic variables based on fossil pollen for the mid-Holocene and the Last Glacial Maximum. The reconstructions are expressed as anomalies and associated uncertainties on a 2×2-degree grid. The data were gridded by simple averaging of the reconstructions in individual grid cells, and the uncertainties were obtained by pooling the prediction error estimates of individual reconstructions. No attempt was made to interpolate or fill in empty grid points.
Please see the original paper for exact definitions of the time slices used here, the specific approaches used in synthesizing data from multiple sources, and recommendations for the use of the data in data-model comparisons.
The gridded reconstructions are available in two formats (binary and text), with one file per variable and per period:
- binary NetCDF files:
variable_delta_period_ALL_grid_2x2.nc- Note: in the NetCDF files, the grid cells where there are no data sites are masked
- text csv files:
variable_delta_period_ALL_grid_2x2.csv- Note: the text files only list the grid cells that contain data sites
Where the variables are…
- mat: Mean Annual Temperature (°C)
- map: Mean Annual Precipitation (mm)
- mtco: Mean Temperature of the Coldest Month (°C)
- mtwa: Mean Temperature of the Warmest Month (°C)
- gdd5: Growing Degree Days above 5°C (°C days)
- alpha: moisture index, defined as Mean Annual Actual Evaporation/Mean Annual Potential Evaporation (no units)
… and the periods are:
- 06ka: mid-Holocene
- 21ka: Last Glacial Maximum
Each variable_delta_period_ALL_grid_2x2 data file contains the following variables:
| Variable | Column (.csv file) | Detail |
|---|---|---|
| lat | 1 | Latitude of grid-cell center (degrees North) |
| lon | 2 | Longitude of grid-cell center (degrees East) |
| variable_anm_mean | 3 | Grid-cell mean of reconstructed anomalies |
| variable_se_mean | 4 | Grid-cell mean of standard errors of estimates |
| variable_tstat | 5 | t-statistic = mean anomaly / mean standard error of estimate = variable_anm_mean / variable_se_mean |
| variable_sig | 6 | Significance of the t-statistic: -1, 0, 1 = sign(variable_tstat) if abs(variable_tstat) > 2 = 0 if abs(variable_tstat) < = 2 |
| variable_sig_value | 7 | Value of anm_mean if the t-statistic was significant = variable_anm_mean if variable_sig <> 0 = 0 if variable_sig == 0 |
| variable_npts | 8 | Number of sites in the grid cell |
History (changes)
- The data files distributed on the PMIP3 site have been updated (from the files originally used in the Bartlein 2011 paper) in order to correct a few values
- The three
variable_delta_period_ALL_grid_2x2_exextended files have the same data as the correspondingvariable_delta_period_ALL_grid_2x2files, and include additional (unpublished) speleothem data and a few sites from the Shakun et al. (2012) appendix and from the Schmittner et al. (2011) Science paper. These have been used in the Harrison et al. (2013) benchmarking paper.- map_delta_06ka_ALL_grid_2x2_ex.[csv, nc]
- mat_delta_06ka_ALL_grid_2x2_ex.[csv, nc]
- mat_delta_21ka_ALL_grid_2x2_ex.[csv, nc]
- The additions consist of:
- Last Glacial Maximum, Mean Annual Temperatures: 1 speleothem record and 2 terrestrial records from Shakun et al.
- Mid-Holocene, Mean Annual Temperatures: 3 speleothem records
- Mid-Holocene, Mean Annual Precipitation: 4 speleothem records
References
- Schmittner, A., N. M. Urban, J. D. Shakun, N. M. Mahowald, P. U. Clark, P. J. Bartlein, A. C. Mix, A. Rosell-Melé, 2011. Climate Sensitivity Estimated from Temperature Reconstructions of the Last Glacial Maximum. Science, 334, 1385-1388, DOI: 10.1126/science.1203513
- Shakun, J. D., P. U. Clark, F. He, S. A. Marcott, A. C. Mix, Z. Liu, B. Otto-Bliesner, A. Schmittner and E. Bard, 2012. Global warming preceded by increasing carbon dioxide concentrations during the last deglaciation, Nature, 484, 49-55, DOI:10.1038/nature10915
- Harrison, S. P., P. J. Bartlein, S. Brewer, I. C. Prentice, M. Boyd, I. Hessler, K. Holmgren, K. Izumi, K. Willis, 2013. Climate model benchmarking with glacial and mid-Holocene climates. Climate Dynamics, DOI 10.1007/s00382-013-1922-6
Download
Contact
You can get the author(s) contact details on the Journal page
[ PMIP3 Wiki Home ] - [ Help! ] - [ Wiki syntax ]

